Graphina – Elementor Charts and Graphs: A Complete Guide
In the digital age, data visualization has become a crucial aspect of how businesses present information. Whether you’re displaying statistics, performance metrics, financial data, or user analytics, presenting this information through visually appealing charts and graphs makes it easier to understand and far more engaging. That’s where Graphina – Elementor Charts and Graphs comes into play.
Graphina is a powerful, user-friendly WordPress plugin designed specifically for Elementor users. It allows you to add a wide variety of interactive charts and graphs to your website with ease—without any coding skills.
In this detailed guide, we’ll explore what Graphina is, its features, use cases, benefits, and how to use it effectively to make your website more informative and interactive.

What is Graphina?
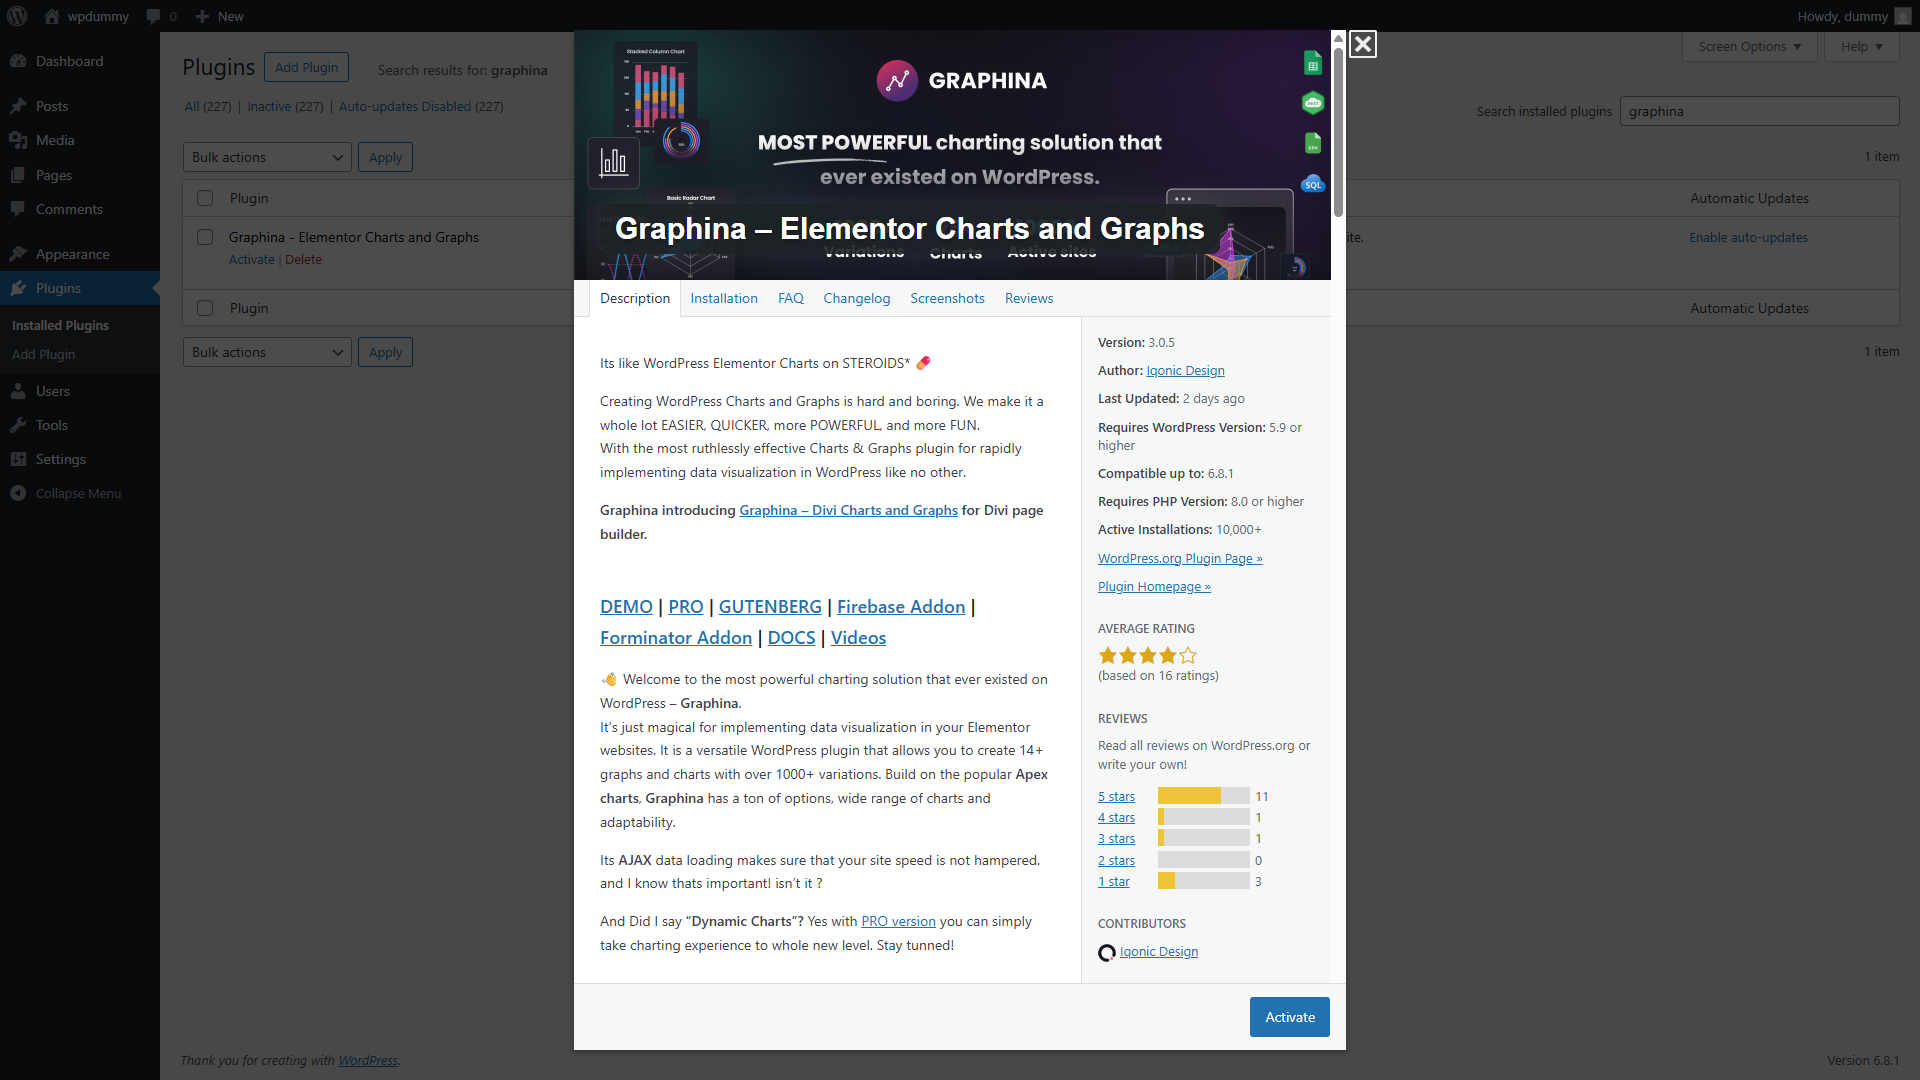
Graphina – Elementor Charts and Graphs is a premium WordPress plugin developed by Iqonic Design, built to help users create interactive, customizable charts and graphs using the Elementor page builder. It supports both static and dynamic data sources, allowing you to create real-time dashboards or beautifully styled infographics for your website.
Whether you’re building a business site, blog, educational platform, or portfolio, Graphina can elevate your content by making data visually digestible.
Key Features of Graphina
1. Wide Range of Chart Types
Graphina supports over 15+ chart types, including:
- Line Charts
- Bar Charts (horizontal/vertical)
- Pie Charts
- Doughnut Charts
- Radar Charts
- Polar Area Charts
- Bubble Charts
- Scatter Charts
- Column Charts
- Funnel Charts
- Heat Maps
- Mixed Charts
- Area Charts
- Range Charts
- Radar with area
These various chart styles allow you to pick the best format for your data presentation.
2. Elementor Integration
Graphina is fully integrated with Elementor. You can add, edit, and customize charts directly within the Elementor visual editor using its drag-and-drop interface—no coding required.
3. Dynamic & Static Data Support
- Static Data: Add values manually in the Elementor interface.
- Dynamic Data: Connect charts to database tables, APIs, or external files (like JSON or Google Sheets) for live updating charts and real-time dashboards.
4. Fully Customizable
Each chart element is fully customizable. You can adjust:
- Colors
- Legends
- Axis labels
- Fonts and sizes
- Backgrounds
- Animations
- Padding and margins
5. Real-Time Updates
Graphina supports live data updates, making it ideal for dashboards, analytics pages, and finance-related websites where data changes frequently.
6. Responsive Design
All charts created with Graphina are mobile-friendly and responsive. They adapt to different screen sizes without breaking the layout or functionality.
7. Multiple Chart Widgets
Each chart type comes as a separate Elementor widget, making the plugin lightweight and modular. You only load what you use.
8. Export Charts
You can allow users to download the charts as PNG, JPG, or PDF, which is useful for data sharing or reports.
9. Animations & Interactivity
Add hover effects, transition animations, and dynamic interactions to charts, making your data more engaging.
Benefits of Using Graphina
1. Professional Data Presentation
Graphina transforms plain numbers into stunning visuals that are easier to interpret, enhancing user understanding and retention.
2. No Coding Required
The plugin is built for non-technical users. Everything is managed via Elementor’s intuitive drag-and-drop interface.
3. Improves Engagement
Interactive charts attract attention and keep visitors engaged longer on your website.
4. Perfect for Any Industry
Whether you’re in healthcare, finance, education, SaaS, or blogging, data visualization with Graphina helps communicate more effectively.
5. Cost-Effective Dashboard Creation
You don’t need third-party services or complex tools to build interactive dashboards—Graphina does it all from within WordPress.
Common Use Cases
1. Business Dashboards
Create dashboards to monitor sales, conversions, user activity, or financial KPIs.
2. Blog Statistics
Share blog traffic, subscriber growth, or post engagement over time.
3. Educational Websites
Showcase performance metrics, grade distributions, or historical comparisons in a visual format.
4. Marketing Reports
Use bar, pie, and funnel charts to display campaign results, traffic sources, and ROI.
5. Real-Time Analytics
Use Graphina’s dynamic data source feature to update graphs in real time, such as live users, stock prices, or weather updates.
How to Use Graphina – Step-by-Step
Step 1: Install Graphina
- Go to Plugins > Add New in your WordPress dashboard.
- Search for “Graphina” (you may need the Pro version for full features).
- Install and activate the plugin.
Step 2: Open Elementor
- Create or edit any page using Elementor Page Builder.
Step 3: Add a Graphina Widget
- In the Elementor sidebar, search for the chart type (e.g., “Graphina Line Chart”).
- Drag and drop the widget into your page section.
Step 4: Configure Your Chart
- Enter your data values, labels, and legend names.
- Set axis titles, font sizes, and colors.
- Choose animation effects if desired.
Step 5: Style Your Chart
- Use the Style tab to customize background, spacing, padding, and overall design.
- Use Elementor’s Responsive Mode to adjust for mobile and tablet.
Step 6: Connect Dynamic Data (Optional)
- Link the chart to your database, REST API, or Google Sheets for real-time updates.
Step 7: Save and Publish
- Click Publish or Update, and your chart goes live!
Graphina Free vs Pro Version
| Feature | Free Version | Pro Version |
|---|---|---|
| Basic Charts (Bar, Pie, Line) | ✅ | ✅ |
| Advanced Charts (Radar, Funnel, Heatmap) | ❌ | ✅ |
| Dynamic Data | ❌ | ✅ |
| Export to Image/PDF | ❌ | ✅ |
| Real-time Data Updates | ❌ | ✅ |
| Multiple Data Sources | ❌ | ✅ |
| Custom Chart Styles | Limited | Full |
| Support & Updates | Community | Premium |
Performance and Compatibility
Graphina is optimized for performance. It uses lightweight code and loads assets only when needed, ensuring fast page speeds. It is compatible with:
- Latest versions of WordPress and Elementor
- Most modern themes
- WooCommerce
- Other plugins like WPML (for translation) and caching tools
Final Thoughts
Graphina – Elementor Charts and Graphs is a comprehensive solution for anyone looking to add beautiful, functional, and interactive data visualizations to their WordPress site. Its deep Elementor integration, wide variety of chart types, and ease of use make it a go-to plugin for beginners and professionals alike.
Whether you’re showcasing analytical data, presenting financial reports, or simply adding flair to your website with infographics, Graphina has you covered. With its Pro version unlocking powerful features like dynamic data, real-time updates, and advanced styling, it’s one of the best investments for data-driven web content.


