by
by Query Monitor Plugin for WordPress: A Comprehensive Overview
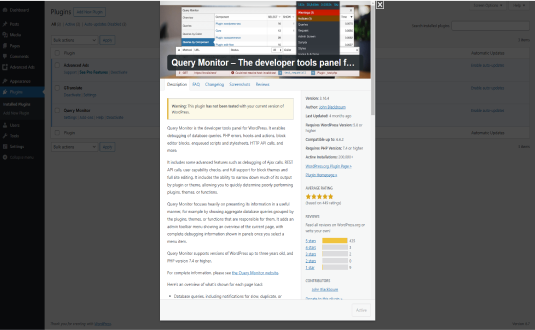
The Query Monitor plugin for WordPress is an invaluable tool for developers, administrators, and anyone managing or troubleshooting WordPress websites. It provides insights into a site’s performance by monitoring queries, PHP errors, and other technical metrics, making it easier to identify and resolve issues. With WordPress being a dynamic CMS, every page load triggers multiple database queries, PHP scripts, and sometimes, external API calls. Each of these elements contributes to the website’s overall load time and server resource usage. The Query Monitor plugin helps pinpoint what could be slowing down a site, enabling targeted improvements.
1. Introduction to Query Monitor
The Query Monitor plugin was developed by John Blackbourn, a prominent contributor to the WordPress community. This plugin offers a powerful yet user-friendly solution for debugging and performance monitoring in WordPress. Unlike most tools that focus solely on query performance, Query Monitor delivers insights across the entire stack—queries, PHP, server, and front-end rendering.
It’s essential for users to understand that while Query Monitor offers extensive debugging information, it’s best suited for staging environments or during development. Deploying it on production sites requires careful use because the detailed logging can sometimes cause additional server load.
2. Key Features of Query Monitor
a. Database Query Insights
One of Query Monitor’s primary functions is to report database query details. Every page request in WordPress typically results in multiple database queries—some for retrieving posts, others for settings, widgets, and more. Query Monitor categorizes these queries by plugin, theme, or function, allowing users to see which parts of the site are running the most queries.
- Query Types: It provides data on various query types, including SELECT, INSERT, UPDATE, and DELETE operations, offering a complete view of database usage.
- Slow Queries: Query Monitor flags slow queries, allowing developers to identify inefficient or costly database operations.
- Duplicate Queries: Duplicated queries, which can unnecessarily increase load times, are also highlighted.
b. PHP Error and Warning Reporting
The plugin catches PHP errors, warnings, and notices, and displays them in an organized way. These errors can originate from plugins, themes, or WordPress core files. By viewing them, developers can identify problematic code segments that may otherwise go unnoticed.
- Error Logging: Logs PHP errors, warnings, and notices in real time, which can be particularly helpful when diagnosing runtime issues.
- Error Origin Tracking: The tool shows which file and line of code triggered the error, providing valuable insight for developers.
c. HTTP API Call Monitoring
Query Monitor also tracks outgoing HTTP API calls, a feature that’s especially useful when working with third-party APIs. External API calls can cause latency if they don’t respond quickly or if the site is making too many requests in a short time.
- API Call Details: The plugin displays the response times of API calls, HTTP status codes, and other details that can reveal bottlenecks.
- Error Detection: Any failed API calls or incorrect responses are flagged, helping developers understand if external services are affecting site performance.
d. Hooks and Actions Analysis
WordPress relies heavily on hooks and actions for extending its functionality, and themes and plugins often register their own. Query Monitor shows all hooks fired during a page load, along with their associated callbacks, making it easier to see how different actions impact site performance.
- Detailed Hook Reporting: Lists each hook and the callback functions attached to it, which is helpful for debugging complex WordPress setups.
- Execution Order: Shows the order in which hooks are fired, a valuable feature when dealing with dependency issues or conflicting plugins.
e. Block and Theme Template Overview
For users working with the WordPress Block Editor or customizing themes, Query Monitor provides details about block and theme templates in use on a page. Understanding template load order can help developers troubleshoot rendering issues and optimize theme performance.
- Template Hierarchy: Displays the templates used to render a page, making it easier to see where changes might be needed.
- Block Information: Lists active blocks on the page and any associated scripts and stylesheets, which can affect load time.
3. How Query Monitor Helps Optimize WordPress Performance
A WordPress site’s performance depends on numerous factors, from hosting infrastructure to the efficiency of database queries. Query Monitor empowers developers by giving them visibility into these factors, allowing them to pinpoint performance issues and optimize their websites. Here are several ways the plugin aids in optimization:
a. Reducing Query Load
High query load, caused by either redundant or unoptimized database queries, is a common reason for slow page loads. Query Monitor provides a clear breakdown of query types, execution time, and source, helping developers identify and remove or optimize queries.
b. Minimizing Duplicate Queries
Duplicated queries can lead to unnecessary database calls, slowing down a page without providing any added benefit. By highlighting duplicates, Query Monitor helps developers reduce these redundancies, enhancing load speed and reducing server resource consumption.
c. Improving PHP Code Quality
PHP errors and warnings can introduce security risks, bugs, or inefficiencies. By catching and detailing these errors, Query Monitor allows developers to proactively resolve issues that could impact site stability or speed.
d. Optimizing External API Usage
While external APIs can add value, they can also lead to performance bottlenecks if not managed correctly. Query Monitor’s HTTP API call tracking helps developers understand which API calls are slowing down page loads, making it easier to decide whether to cache responses or reconsider integration points.
4. User Interface and Usability
Query Monitor’s interface is accessible directly from the WordPress admin bar, which provides an in-context view of performance data. This design choice makes it easy for users to troubleshoot performance issues without needing to navigate away from the page they’re viewing.
The interface is divided into several tabs, each focusing on a different aspect of performance (queries, PHP errors, hooks, etc.). Each tab provides a granular breakdown, enabling users to delve deep into specific issues.
Color-coded Highlights: Query Monitor color-codes performance data to show critical information at a glance. Slow queries, errors, and other problem areas are marked with different colors, helping users prioritize their debugging efforts.
5. Compatibility with Other Plugins and Tools
While Query Monitor is compatible with many popular WordPress plugins, some may conflict, particularly those that also perform debugging or database modifications. However, since Query Monitor is a read-only plugin (it doesn’t change database data), conflicts are rare and are usually limited to performance-related tools.
The plugin is compatible with most caching plugins, including WP Rocket and W3 Total Cache. However, users should be mindful that caching plugins can sometimes obscure data, as cached pages may not show real-time queries.
6. Ideal Use Cases and Best Practices
a. Development and Staging Environments: Since Query Monitor provides such detailed insights, it’s best to use it in development or staging environments. On live sites, it can sometimes introduce additional load, although it’s generally safe if used only as needed.
b. Testing New Plugins and Themes: When installing new plugins or themes, developers can use Query Monitor to assess any performance impact. By observing query load, PHP errors, and resource usage before and after installation, users can make informed decisions about new additions to their site.
c. Troubleshooting Performance Issues: Query Monitor shines when a website is experiencing unexplained performance issues. Its comprehensive breakdown helps identify whether the issue lies in the database, PHP, or external services.
7. Alternatives to Query Monitor
While Query Monitor is a robust solution, other plugins also offer performance monitoring:
- New Relic: An advanced application monitoring tool that can track server-side performance metrics but is more complex to configure and use.
- Debug Bar: A simpler debugging plugin that focuses on PHP errors, hooks, and actions without providing as much depth as Query Monitor.
- WP DB Manager: Useful for managing and optimizing the database, though it lacks Query Monitor’s depth in query monitoring.
8. Conclusion
The Query Monitor plugin for WordPress is a powerful tool for developers, offering invaluable insights into the performance and functionality of a website. By highlighting areas such as database queries, PHP errors, and external API calls, Query Monitor allows users to identify and rectify issues that could impact performance or usability. Whether used in development or troubleshooting on live sites, it is an essential tool for anyone serious about optimizing and maintaining a high-performing WordPress site.
With the increased emphasis on website speed and user experience, Query Monitor provides the necessary data to keep WordPress sites running smoothly and efficiently.