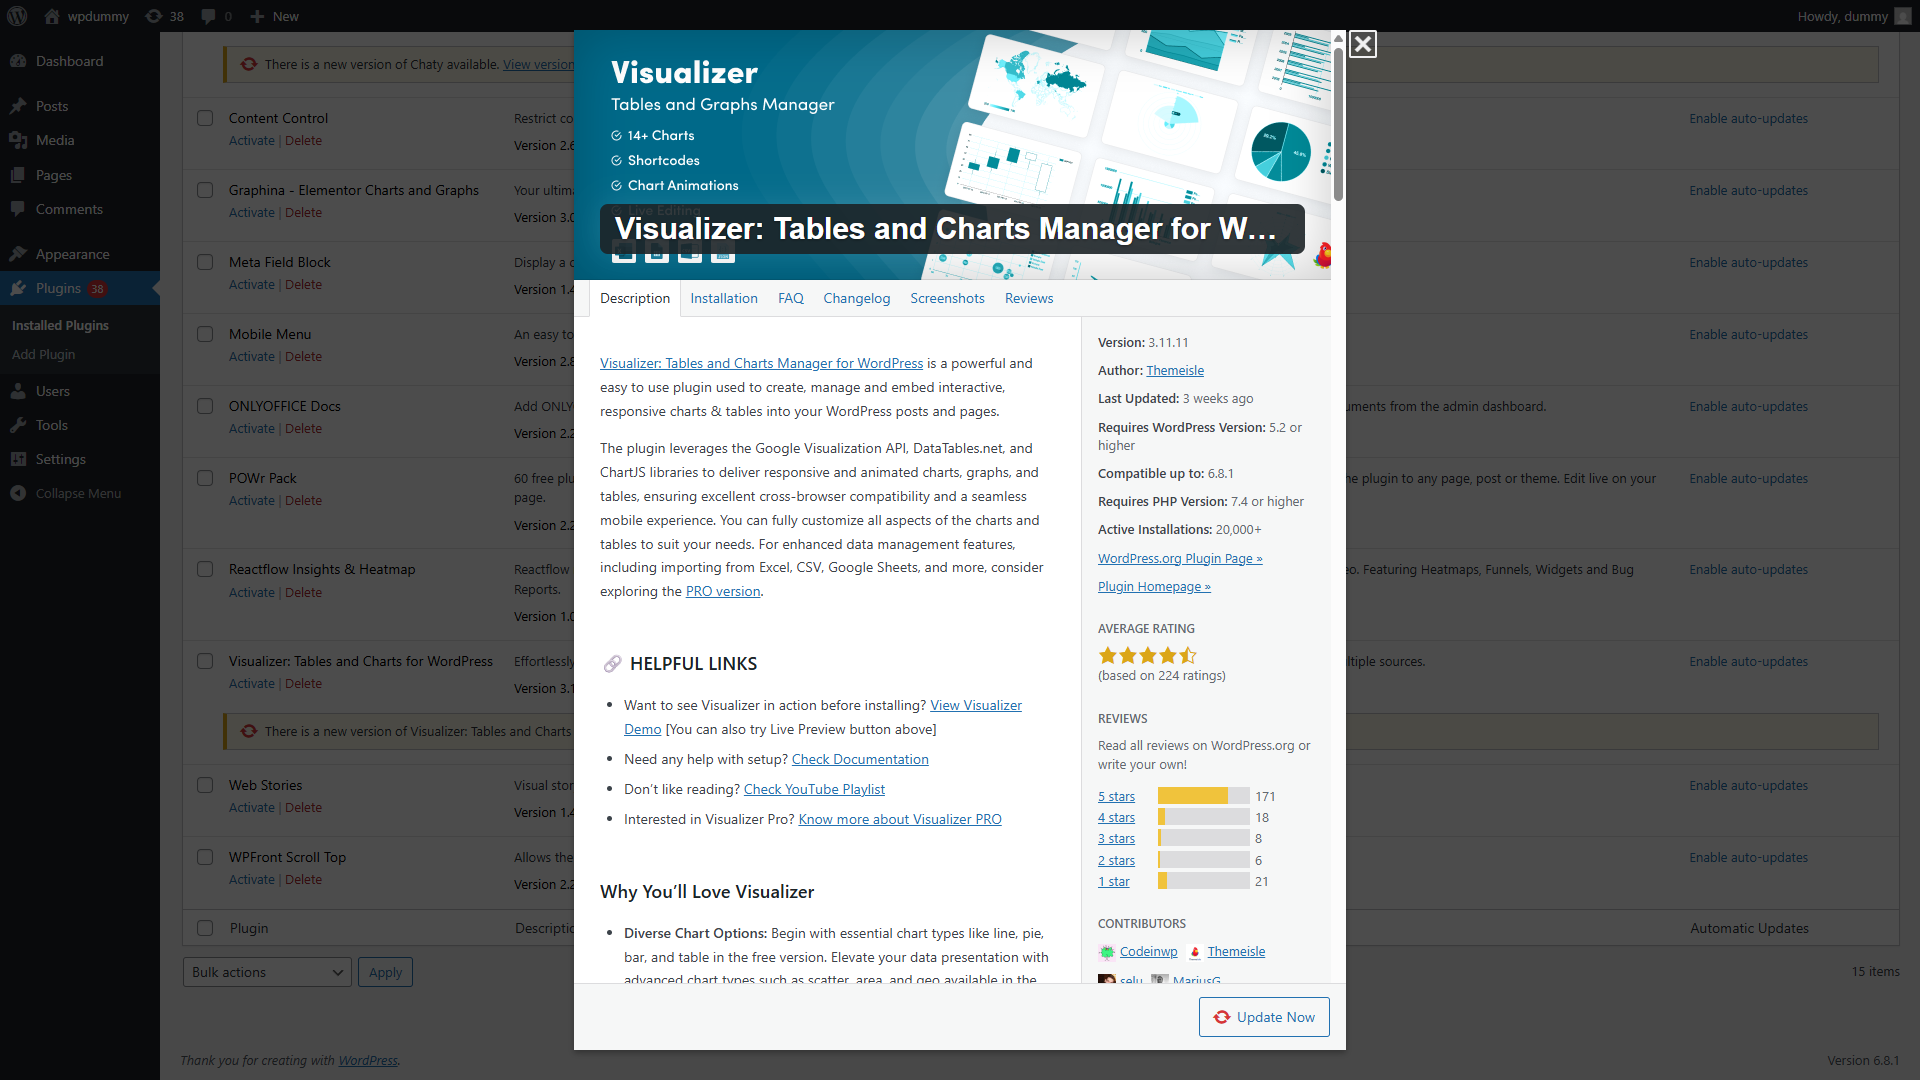
Visualizer: Tables and Charts Manager for WordPress
Visualizer is a powerful, intuitive, and feature-rich plugin for WordPress that allows users to easily create, manage, and embed interactive charts and responsive data tables in posts, pages, and widgets. Developed by Themeisle, Visualizer is especially popular among bloggers, marketers, educators, eCommerce site owners, and anyone who needs to present data visually in a clear and engaging way.
Using modern charting libraries like Google Visualization API, Chart.js, and DataTables.js, Visualizer ensures a smooth, interactive, and customizable user experience for visual data storytelling — without writing a single line of code.

What is Visualizer?
Visualizer: Tables and Charts Manager for WordPress is a powerful plugin developed by Themeisle, a well-known name in the WordPress ecosystem. This plugin allows users to create interactive charts and responsive data tables directly from the WordPress dashboard using an intuitive interface.
Whether you’re displaying statistical data, financial reports, survey results, or dynamic tables, Visualizer provides an easy way to integrate compelling visuals into your site content.
Key Features
1. Interactive Charts
Visualizer supports a wide variety of chart types including:
- Line Charts
- Bar Charts (Horizontal and Vertical)
- Area Charts
- Pie Charts
- Donut Charts
- Column Charts
- Scatter Charts
- Geo Charts
- Bubble Charts
- Gauge Charts
- Timeline Charts
Each chart is interactive, meaning users can hover to see tooltips, click for details, and sometimes even toggle data views. This interactivity enhances user engagement.
2. Responsive Tables
Tables are often difficult to display properly on mobile devices. Visualizer’s responsive tables adapt to any screen size, ensuring your data looks clean and professional on phones, tablets, and desktops alike.
3. CSV Import & Google Sheets Sync
You can import data from CSV files or connect the plugin to a live Google Sheet. This is extremely useful for dynamic content that changes frequently, such as stock updates, sales metrics, or survey results.
4. Live Editing & Preview
Visualizer lets you edit chart and table data within the WordPress dashboard and see a live preview before publishing. The built-in editor mimics spreadsheet functionality, so even users without coding knowledge can manage data easily.
5. Customizable Design
The plugin supports extensive customization. You can change colors, fonts, chart dimensions, data labels, legends, and tooltips, allowing full control over how your visual elements appear.
6. Shortcode Support
Each chart or table can be embedded anywhere on your site using a simple shortcode. This makes it easy to insert visuals into posts, pages, widgets, and even custom templates.
7. User Role Permissions (PRO)
Visualizer Pro offers user access control, allowing site administrators to restrict editing or viewing capabilities based on user roles.
8. Data Sorting and Filtering
Tables created with Visualizer allow for column sorting and filtering, helping users navigate large datasets more efficiently.
Use Cases
1. Business & Finance
Use bar and line charts to show sales trends, revenue growth, or budget comparisons. Visualizer’s ability to sync with Google Sheets ensures that data is always up to date.
2. Education & Research
Educators and researchers can display study results, academic scores, or scientific findings using scatter, bubble, or area charts. The tool’s interactive nature makes learning more engaging.
3. Blogging
Food bloggers can use tables to list recipes; travel bloggers can display comparison charts for destinations. The versatility of Visualizer fits nearly every blogging niche.
4. News & Media
Journalists and media websites can use geo charts and pie charts to present political poll results, demographic breakdowns, or economic data.
Free vs Pro Version
Free Version Features:
- 9 chart types
- Responsive design
- Manual data entry
- CSV import
- Shortcode support
- Live chart preview
Pro Version Features:
- 15+ chart types (including geo, gauge, timeline)
- Google Sheets integration
- Private charts
- Import/export visualizations
- Front-end editing
- Role-based access control
- Automatic chart updates
The Pro version is ideal for users who need advanced functionalities, frequent data updates, or team collaboration features.
How to Use Visualizer
Step 1: Install the Plugin
From your WordPress dashboard, go to Plugins > Add New, search for “Visualizer,” install it, and activate.
Step 2: Create a Chart or Table
Navigate to Media > Visualizer Library, click on “Add New,” and select the type of chart or table you want.
Step 3: Import Data
You can upload a CSV file or manually input the data. In the Pro version, you can also link a Google Sheet for live sync.
Step 4: Customize Appearance
Modify chart colors, fonts, borders, axis labels, tooltips, and other display settings to match your site’s design.
Step 5: Insert into Post/Page
Copy the shortcode and paste it into any WordPress post or page where you want the chart to appear.
Compatibility and Performance
Visualizer is well-coded and optimized for performance. It works seamlessly with most popular WordPress themes and page builders including:
- Elementor
- Gutenberg
- WPBakery Page Builder
- Beaver Builder
It is also compatible with caching plugins, multilingual plugins like WPML, and responsive frameworks like Bootstrap.
Pros and Cons
Pros:
- Easy to use, even for non-technical users
- Variety of interactive chart types
- Google Sheets integration
- Responsive and mobile-friendly
- Highly customizable
- Shortcode embedding for flexibility
Cons:
- Some advanced chart types only available in Pro
- Limited design themes compared to specialized charting libraries like Chart.js
- Google Sheets sync only in the paid version
Comparison with Other Plugins
| Feature | Visualizer | WP Table Builder | Data Tables Generator |
|---|---|---|---|
| Chart Types | 15+ | Limited | Moderate |
| CSV Import | Yes | Yes | Yes |
| Google Sheets Sync | Yes (Pro) | No | No |
| Shortcode Support | Yes | Yes | Yes |
| Table Sorting/Filtering | Yes | Yes | Yes |
| Interactive Charts | Yes | No | Limited |
Visualizer stands out because of its balance between ease of use, visual appeal, and data interactivity.
Final Thoughts
Visualizer: Tables and Charts Manager for WordPress is an outstanding plugin for anyone looking to present data in a visually engaging and dynamic format. Its combination of user-friendly features, wide chart variety, responsive design, and compatibility with popular WordPress tools makes it suitable for beginners and professionals alike.
Whether you’re managing a small blog or a large-scale website with complex datasets, Visualizer helps you convey information effectively — transforming raw numbers into insights your audience can easily grasp.
If you’re serious about data presentation and want to go beyond static tables and text, Visualizer is a reliable and feature-rich solution worth exploring.


